In the post Waving for World Arthritis Day!, it has some European statistics on arthritis. I wanted to add some of the US statistics but the information I wanted to use made the post much too long. So I decided to add a second post. In this post, I am dealing with information on arthritis as defined below by the CDC. It's not specific to autoimmune arthritis, osteoarthritis, or any one type. I haven't used ALL of their statistical information but a good bit of it.I am finding all of this information very eye opening. Costs of arthritis, the most common types of arthritis and the breakdowns by age/sex/race are all so interesting to me.
As defined by the CDC:
Arthritis Basics
Although
the word arthritis actually means joint inflammation, we use the term
arthritis in the public health world to describe more than 100 rheumatic
diseases and conditions that affect joints, the tissues which surround
the joint and other connective tissue. The pattern, severity and
location of symptoms can vary depending on the specific form of the
disease. Typically, rheumatic conditions are characterized by pain and
stiffness in and around one or more joints. The symptoms can develop
gradually or suddenly. Certain rheumatic conditions can also involve the
immune system and various internal organs of the body.
More information about common Arthritis Types is available.
Based on 2007-2009 data from the National Health Interview Survey (NHIS)(1), an estimated
- 50 million (22%) of adults have self-reported doctor-diagnosed arthritis.
- 21 million (9% of all adults) have arthritis and arthritis-attributable activity limitation.
{And these are just the people that actually have a type
of arthritis. The effects go deeper into the family, friends, co-workers,
and employers/employees of the one who has a type of arthritis. So the
number of people affected is even larger. Arthritis doesn't just affect the person who is diagnosed with it.}
Based on 2003 NHIS data (2) a projected
- 67 million (25%) adults aged 18 years or older will have doctor-diagnosed arthritis by the year 2030.
- An estimated 37% (25 million adults) of those with
arthritis will report arthritis-attributable activity limitations
by the year 2030.
Additional Information
The best source for national arthritis prevalence estimates
is the National Health Interview Survey (NHIS), an annual survey
conducted by the National Center for Health Statistics. Each year, the
NHIS samples U.S. households and gathers information on select adult
and child members living in each household. Estimates of health
conditions and behaviors from the NHIS are representative of the U.S.
civilian, non-institutionalized population. Read more about the
NHIS surveillance. Specific NHIS Arthritis related questions (ACN.250_00.000 through ACN.295.000) are
available  [PDF - 2.2Mb]
 .
More on the impact of arthritis and associated health behaviors:
References
-
Cheng YJ, Hootman JM, Murphy LB, Langmaid GA, Helmick CG.
Prevalence of doctor-diagnosed arthritis and arthritis-attributable
activity limitation — United States, 2007–2009. MMWR 2010;59(39):1261–1265. html pdf [1.61 MB]
- Hootman JM, Helmick CG. Projections of U.S. prevalence of arthritis and associated activity limitations. Arthritis Rheum 2006;54(1):266–229. abstract

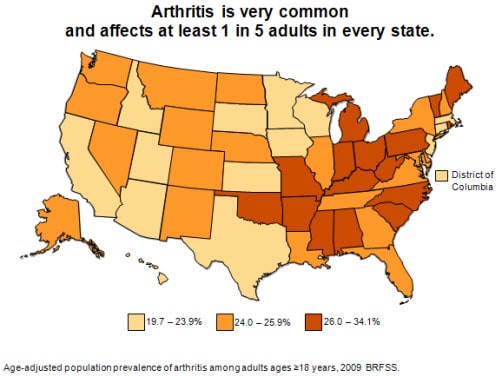
State-level Behavioral Risk Factor Surveillance System
2009 prevalence estimates found that arthritis is reported by at least
one in five adults in every state. Only fourteen states, plus the
District of Columbia, were in the lowest prevalence group. In the 16
states with the highest prevalence, arthritis affects up to one in
three adults.
CDC unpublished data.
Data source: BRFSS 2009.
{Source same as picture}
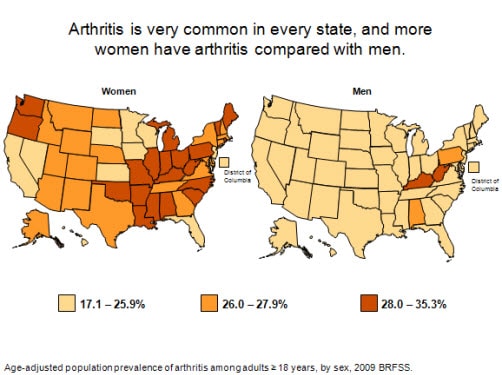
State-level Behavioral Risk Factor Surveillance System 2009
prevalence estimates by sex found women reporting a higher prevalence
of arthritis than men in every state. When examined by the same
prevalence cutoff points (17.1–25.9%; 26.0–27.9%; and 28.0–35.3%),
there were only two states in which both women and men were in the
highest prevalence group (Kentucky and West Virginia). For the most
part, women were in the middle and high prevalence group, but men were
in the lowest prevalence group for all but four states. In the majority
of jurisdictions (40 states and D.C.), at least one in every four
women report arthritis.
CDC unpublished data
Data Source: BRFSS 2009
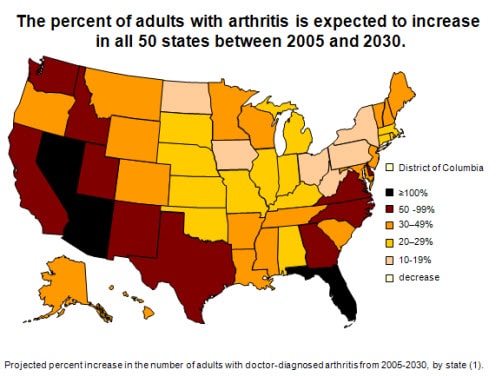
State-specific projections of arthritis prevalence from
2005 through 2030 show a substantial, average increase of 34% in all
states. Ten states are anticipated to have increases from 50%–90%, and
three states (Arizona, Florida, and Nevada) are projected to see their
numbers more than double. Similar increases are projected for
arthritis-attributable activity limitation. The biggest projected
increases are expected to occur in the “sunbelt” and western states.
These projections highlight the need for wider dissemination of
existing evidence-based interventions and strategies that have been
shown to decrease pain and increase function.
| A
table offering more detailed state specific data is available.
Freedman M, Hootman JM, Helmick CG. Projected state-specific
increases in self-reported doctor-diagnosed arthritis and
arthritis-attributable activity limitations—United States, 2005–2030.
MMWR 2007;56(7):423–425.
errata html; html; pdf [528K]
In all states, working-age (ages 18-64) U.S.
adults face work limitations they attribute to arthritis. The
prevalence of arthritis-attributable work limitation varies by state
but is generally high, affecting from 4.0% to 12.6% of all working-age
adults. For example, a state with a population prevalence of
arthritis-attributable work limitation of 7% could be expressed as:
approximately 1 out of every 14 working-age adults in the state report
doctor-diagnosed arthritis and say that it limits them in their work.
CDC unpublished data
Data Source: BRFSS 2009
Arthritis-attributable work limitation is very common among
working-age (ages 18-64) adults with arthritis. In states with the
lowest prevalence of arthritis-attributable work limitations, it is
still reported by greater than 1 of every 4 working-age adults with
arthritis (25%). In states with the highest prevalence of
arthritis-attributable work limitation, that ratio jumps to
approximately 1 of every 2 working-age adults with arthritis.
CDC unpublished data
Data Source: BRFSS 2009
In every state, adults with arthritis have significantly
higher prevalence of no leisure-time physical activity (LTPA) compared
with adults without arthritis. In 23 states, the prevalence of no LTPA
among adults with arthritis is particularly high (≥30%). Adults with
arthritis comprise a large proportion (≥33%) of all adults reporting no
LTPA in every state.
A
table offering more detailed state specific data is available.
Hootman JM, Barbour KE, Watson KB, Harris C. State-specific
prevalence of no leisure-time physical activity among adults with and
without doctor-diagnosed arthritis—United States, 2009.
MMWR. 2011; 60(48):1641-1645.
html pdf [1.10MB]
Data Source: BRFSS 2009
The prevalence of adults with
arthritis-attributable activity limitation ranges from 7.3% to 16.7%.
These high rates of arthritis-attributable activity limitation are
projected to increase with the aging of the population, requiring
increased intervention measures to reduce this impact.
Arthritis-attributable activity limitation can be prevented or reduced
in many persons. In fact, both aerobic and strengthening exercises can
improve physical function and self-reported arthritis disability.
Self-management education classes can also increase confidence in one’s
ability to manage arthritis.
CDC unpublished data
Data Source: BRFSS 2009
The proportion of adults with arthritis who
have arthritis-attributable activity limitations is substantial. In
every state at least one in three adults with arthritis reports
arthritis-attributable activity limitations. In some states, more than
one in two adults reports arthritis-attributable activity limitations.
CDC unpublished data
Data Source: BRFSS 2009
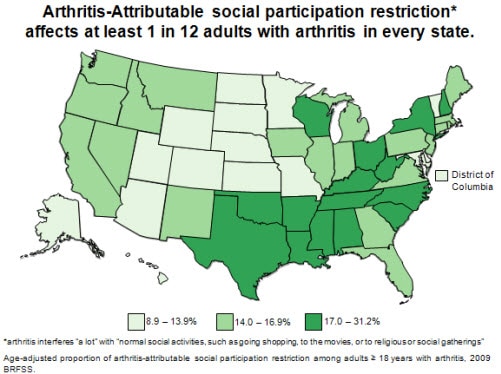
Arthritis-Attributable social participation
restriction is defined here as an answer of “a lot” to a question asking
how much arthritis has interfered with “normal social activities, such
as going shopping, to the movies, or to religious or social
gatherings.” The proportion of adults with arthritis-attributable
social participation restriction ranges from about one in twelve to one
in three adults across states, indicating that it is a substantial
problem caused by arthritis.
CDC unpublished data
Data Source: BRFSS 2009
Pain is a common symptom of arthritis.
Arthritis-Attributable severe joint pain is reported by at least one in
seven adults with arthritis in every state. In states with the highest
prevalence of arthritis-attributable severe joint pain, it is more
common than every one in three adults with arthritis.
CDC unpublished data
Data Source: BRFSS 2009
To demonstrate the economic impact of
arthritis and other rheumatic conditions (AORC) in each state, this
map shows the proportion of each state economy spent on AORC
attributable costs relative to the economy of each state. In 2003,
costs attributable to AORC represented between 0.3 to 2.6% of each
state’s GDP. For example: in 2003, the costs attributable to AORC in
West Virginia were $1.2 billion and this represented 2.6% of West
Virginia’s GDP.
Murphy L, Cisternas M, Yelin E, Trupin L,
Helmick C. Update: Direct and indirect costs of arthritis and other
rheumatic conditions—United States, 1997.
MMWR 2004;53(18):388–389.
html; pdf [273K]
Data Source: Medical Expenditure Panel Survey (MEPS) 2003 and BRFSS 2003
State-specific 2003, 2005, 2007 and 2009 BRFSS prevalence estimates
The
Behavioral Risk Factor Surveillance System
(BRFSS) is the best source for state-specific arthritis prevalence
estimates. BRFSS is a state-based, random-digit-dialed telephone survey
of the noninstitutionalized, civilian U.S. population ages ≥ 18 years.
The survey is administered in all 50 states, the District of Columbia,
Puerto Rico, Guam, and the Virgin Islands. Since 1996, selected states
have been collecting information on arthritis through BRFSS.
Starting with the 2003 BRFSS and continuing in odd-numbered
years, all states collected information on arthritis. Different
questions were used to collect data between 1996–2001 and from 2002
forward. For this reason, it is not valid to look at trends that cross
from 2001 into 2002. In 2002, the case definition of arthritis changed
as well. Beginning in 2002 we have focused on doctor-diagnosed
arthritis only. Read more about the
BRFSS arthritis-specific questions and the
arthritis case definitions.
Data Source: BRFSS 2009
Territorial Statistics
(Data Source: Behavioral Risk Factor Surveillance System (BRFSS)
Note: We have always
seen some fluctuation from year-to-year in state-specific BRFSS
estimates, such as those for “Adults with arthritis” and “Adults
limited by arthritis.” This is partly a function of using BRFSS
samples that by chance are more or less representative of the target
population, and we caution against making too much of year-to-year
variations and instead look at the long term trend. State-specific
BRFSS arthritis estimates remain the best that are available, and the
main point for every state and territory is that arthritis has a large
public health impact.
Estimates represented by an asterisk (*) have relative a
standard error greater than 30% and do not meet the standards of
reliability or precision.
{I am only copying South Carolina here to show what info is available on the state statistics page because it is where I live, but the links above lead to the other states.}
| Adults with arthritis |
934,000 |
967,000 |
956,000 |
1,022,000 |
| Adults limited by arthritis |
345,000 |
370,000 |
372,000 |
481,000 |
| % of adults with arthritis |
30 |
31 |
30 |
31 |
| % women/men with arthritis |
34/26 |
34/27 |
34/25 |
35/26 |
| % whites with arthritis |
32 |
31 |
32 |
32 |
| % blacks with arthritis |
28 |
28 |
25 |
26 |
| % Hispanics with arthritis |
27 |
21 |
18 |
22 |
| % 18–44 year olds with arthritis |
14 |
15 |
13 |
15 |
| % 45–64 year olds with arthritis |
42 |
41 |
40 |
40 |
| % 65+ year olds with arthritis |
58 |
59 |
58 |
55 |
| % with arthritis who are overweight or obese |
66 |
71 |
71 |
73 |
| % with arthritis who are physically inactive |
21 |
19 |
21 |
21 |
| View a detailed summary of the most current estimates. [PDF - 135KB |
National and state cost estimates
- The total costs attributable to arthritis and other
rheumatic conditions (AORC) in the United States in 2003 was
approximately $128 billion. This equaled 1.2% of the 2003 U.S. gross
domestic product.
- $80.8 billion were direct costs (i.e., medical expenditures)
- $47.0 billion were indirect costs (i.e., lost earnings)
- Total costs attributable to AORC, by state, ranged from
$226 million in the District of Columbia to $12.1 billion in
California.
- National medical costs attributable to AORC grew by 24%
between 1997 and 2003. This rise in medical costs resulted from an
increase in the number of people with AORC.
- In 2003, costs attributable to AORC represented between
0.3 to 2.6% of each state’s GDP. For example: in 2003, the costs
attributable to AORC in West Virginia were $1.2 billion and this
represented 2.6% of West Virginia’s GDP.
- [Note: CDC is currently updating national cost
estimates for AORC to 2008. The CDC Arthritis program is also a
member of the CDC Chronic Disease Cost Calculator working group which
is developing state-level cost estimates. AORC will be among the
conditions included in the next release of the calculator.]
Study reports on arthritis costs:
A detailed report on the national cost study, including the
study methods and comparisons of 1997 and 2003 costs, was published
in:
Yelin E, Murphy L, Cisternas M, Foreman A, Pasta D,
Helmick C. Medical Care Expenditures and Earnings Losses Among Persons
with Arthritis and Other Rheumatic Conditions in 2003, and
Comparisons to 1997. Arthritis and Rheumatism 2007;56(5):1397-1407.
Yelin E, Cisternas M, Foreman A, Pasta D, Murphy L,
Helmick C. National and state medical expenditures and lost earnings
attributable to arthritis and other rheumatic conditions — United
States, 2003.
MMWR 2007;56(1):4–7.
html pdf [306K]
The table below shows the total costs* (in millions of dollars)
attributable to arthritis and other rheumatic conditions for each
state in 2003.
Total Costs* (in millions) attributable to Arthritis and Other Rheumatic Conditions, By State, United States, 2003
|
| $225 million to $574 million
|
$650 million to $1.6 billion
|
$1.9 billion to $2.9 billion
|
$3.2 billion to $12.1 billion
|
| District of Columbia |
226 |
Nebraska |
757 |
Colorado |
1,920 |
Indiana |
3,181 |
| Wyoming |
243 |
New Mexico |
770 |
Louisiana |
2,036 |
Tennessee |
3,271 |
| Alaska |
275 |
Utah |
820 |
South Carolina |
2,133 |
Virginia |
3,466 |
| North Dakota |
285 |
Nevada |
1,022 |
Minnesota |
2,172 |
New Jersey |
3,544 |
| Vermont |
290 |
Kansas |
1,106 |
Arizona |
2,343 |
Georgia |
3,911 |
| South Dakota |
351 |
West Virginia |
1,188 |
Kentucky |
2,426 |
North Carolina |
4,112 |
| Delaware |
363 |
Iowa |
1,250 |
Wisconsin |
2,445 |
Michigan |
5,557 |
| Hawaii |
375 |
Arkansas |
1,441 |
Maryland |
2,479 |
Ohio |
5,745 |
| Montana |
396 |
Connecticut |
1,443 |
Alabama |
2,597 |
Pennsylvania |
6,578 |
| Rhode Island |
511 |
Mississippi |
1,495 |
Illinois |
2,670 |
Florida |
7,624 |
| Idaho |
564 |
Oregon |
1,609 |
Massachusetts |
2,734 |
Texas |
8,706 |
| New Hampshire |
574 |
Oklahoma |
1,628 |
Washington |
2,787 |
New York |
8,726 |
| Maine |
648 |
|
|
Missouri |
2,874 |
California |
12,137 |
* Total costs = medical expenditures + lost earnings
Yelin E, Cisternas M, Foreman A, Pasta D, Murphy L, Helmick
C. National and state medical expenditures and lost earnings
attributable to arthritis and other rheumatic conditions — United
States, 2003.
MMWR 2007;56(1):4–7.
html pdf [306K]
From 1997 to 2005, total national expenditures among all
US adults with arthritis increased from by 100 billion dollars. Medical expenditures were $252.0 billion in 1997 and $353.0 billion in 2005.
(Cisternas et al 2009)
Why did total national medical expenditures among all adults with arthritis increase from 1997 to 2005?
- The rise in medical expenditures in this time period is attributable to two distinct factors:
- The number of people with arthritis and other rheumatic conditions increased by 22%
- Medical expenditures for each person with arthritis increased by 15%
Total national medical expenditures among US adults with arthritis, 1997 to 2005
Data source: Medical Expenditure Panel Survey, 1997-2005
Expenditures for each individual are the
sum of the following: inpatient, outpatient, office visit, home health,
emergency, prescription medications, and other.
The graph above shows that ––
- From 1995 to 2005, the total national medical expenditures among adults with arthritis only remained stable.
- However, total medical expenditures rose by 27% among people who had arthritis and one or more co-occurring chronic conditions.
- This increase in expenditures resulted from a rise
in number of people with arthritis who also have co-occurring chronic
conditions such as diabetes and heart disease.
- In 1997, 36.8 million people with arthritis had
co-occurring chronic conditions and by 2005, this had risen to 44.9
million people.
Cisternas MG, Murphy LB, Yelin EH, Foreman AJ, Pasta DJ,
Helmick CG. Trends in Medical Care Expenditures of US Adults with
Arthritis and Other Rheumatic Conditions 1997 to 2005
J Rheumatol 2009;36(11):2531-2538.
abstract
What is co-morbidity?
The presence of more than one disease or condition in the same person at the same time.
Conditions described as co-morbidities are often chronic
or long-term conditions. Other names to describe co-morbid conditions
are coexisting or co-occurring conditions.
The CDC Arthritis Program examines co-morbidities in the following two ways:
- Co-morbidities among people with arthritis. Everyone in this group has arthritis, plus at least one additional condition.
- Arthritis among people with other chronic conditions. A subset of people with other chronic conditions who also have arthritis.
Note: There are different data sources for some of the
arthritis related statistics therefore; case definitions and terminology will
also vary.
Read more.
The most common form of arthritis is osteoarthritis. Other common rheumatic
conditions include gout, fibromyalgia and rheumatoid arthritis.
An estimated 27 million adults had osteoarthritis in 2005.
Arthritis Rheum
2008;58(1):26–35. [Data Source: NHANES]
An estimated 1.5 million adults had rheumatoid arthritis in 2007.
Arthritis Rheum. 2010 Jun;62(6):1576-82. [Data source: Patient Cohort, Minnesota]
An estimated 3.0 million adults had gout in 2005, and 6.1 million adults have
ever had gout.
Arthritis Rheum 2008;58(1):26–35.
[Data Source: 1996 NHIS]
An estimated 5.0 million adults had fibromyalgia in 2005.
Arthritis Rheum
2008;58(1):26–35.
Note: There are different data sources for some of the
arthritis related statistics therefore; case definitions and terminology will
also vary.
Read more.
Of persons ages 18–44, 7.6% report doctor-diagnosed
arthritis. Of persons ages 45–64, 29.8% report
doctor-diagnosed arthritis. Of persons ages 65 or older, 50.0% report doctor-diagnosed arthritis.
MMWR 2010;59(39);1261-1265.
[Data Source: 2007–2009 NHIS]
25.9% of women and 18.3% men report doctor-diagnosed
arthritis.
MMWR 2010;59(39);1261-1265.
[Data Source: 2007–2009 NHIS]
An estimated 294,000 children under age 18 have some form of arthritis or
rheumatic condition; this represents approximately 1 in every 250 children in the U.S.
Arthritis Care Res 2007;57:1439-1445 [Data Source: 2001–2004 National Ambulatory
Medical Care Survey and 2001–2004 National Hospital Ambulatory Medical Care
Survey]
2.9 million Hispanic adults report doctor-diagnosed arthritis.
4.6 million Non-Hispanic Blacks report doctor diagnosed arthritis.
667,000 Asian/Pacific Islanders and 280,000 American Indians/Alaska Natives report doctor-diagnosed arthritis.
Note: There are different data sources for some of the
arthritis related statistics; therefore, case definitions and
terminology will also vary.
Read more.
People who are overweight or obese report doctor-diagnosed arthritis
more often than people with a lower body mass index (BMI).
16.4% of under/normal weight adults report
doctor-diagnosed arthritis.
MMWR 2010;59(39);1261-1265.
[Data Source: 2007–2009 NHIS]
21.4% of overweight and 31.1% of obese Americans report
doctor-diagnosed arthritis.
MMWR 2010;59(39);1261-1265.
[Data Source: 2007–2009 NHIS]
66% of adults with doctor-diagnosed arthritis are
overweight or obese (compared with 53% of adults without doctor-diagnosed
arthritis).
Am J Prev Med 2006;30(5):385–393. [Data Source: 2002 NHIS]
Weight loss of as little as 11 pounds reduces the risk
of developing knee osteoarthritis among women by 50%
Arthritis Rheum
1998;41(8):1343–1355. [Data source: Framingham Osteoarthritis Study]
Note: There are different data sources for some of the
arthritis related statistics; therefore, case definitions and
terminology will also vary.
Read more.
Almost 44% of adults with doctor-diagnosed arthritis report no leisure time
physical activity compared with 36% of adults without arthritis.
Am J Prev Med 2006;30(5):385-393.
Among older adults with knee osteoarthritis, engaging in moderate physical activity
at least 3 times per week can reduce the risk of arthritis-related disability by
47%.
Arch Intern Med 2001;161(19):2309–2316. [Data Source: FAST Trial]
Note: There are different data sources for some of the
arthritis related statistics; therefore, case definitions and
terminology will also vary.
Read more.
Most Common Cause of Disability
Arthritis and other rheumatic conditions are the most common
cause of disability among U.S. adults and have been for the past 15
years.
MMWR 2009;58(16):421-426. [Data Source: 2005 Survey of Income and Program Participation (SIPP)]
Activity Limitation
Among all civilian, non-institutionalized U.S. adults 9.4%
(21 million) report both doctor-diagnosed and arthritis attributable
activity limitations.
MMWR 2010;59(39);1261-1265. [Data Source: 2007–2009 NHIS]
42% of adults with doctor-diagnosed arthritis report arthritis-attributable activity limitations.
MMWR 2010;59(39);1261-1265. [Data Source: 2007–2009 NHIS]
Among adults with doctor-diagnosed arthritis, many report significant limitations in vital activities such as:
- walking 1/4 mile—6 million
- stooping/bending/kneeling—8 million
- climbing stairs—5 million
- social activities such as church and family gatherings—2 million
Arthritis Rheum 2004;50(9, suppl):5641. [Data Source: 2002 NHIS]
Work Limitation
Approximately 1 in 3 people with arthritis (31%) in between the ages
of 18 and 64 report arthritis-attributable work limitation.
MMWR 2005;54(5):119–123. [Data Source: 2002 NHIS]
Among all civilian, non-institutionalized U.S. adults ages
18-64, 5% (8.2 million) report both doctor diagnosed arthritis and
arthritis-attributable work limitations.
MMWR 2005;54(5):119–123. [Data Source: 2002 NHIS]
State-specific prevalence estimates of
arthritis-attributable work limitation show a high impact of arthritis
on working-age (18-64 years) adults in all U.S. states, ranging from a
low of 3.4% to a high of 15% of adults in this age group.
MMWR 2007;56(40):1045-1049. [Data Source: 2003 BRFSS]
Note: There are different data sources for some of the
arthritis related statistics; therefore, case definitions and
terminology will also vary.
Read more.
People with doctor-diagnosed arthritis have significantly worse HRQOL
than those without arthritis. Adults with arthritis report two to four
times as many unhealthy days in the past month than those without
arthritis.
Arthritis Care Res 2011;63(6):788-99. [Data Source: 2005, 2007, 2009 BRFS
Note: There are different data sources for some of the
arthritis related statistics; therefore, case definitions and
terminology will also vary.
Read more.
Hospitalizations
In 2004, there were an estimated 744,000 hospitalizations with a
principal
diagnosis of arthritis (3% of all hospitalizations). Overall, 5 million
hospitalizations had a principal or secondary diagnosis of arthritis.
[Data source: 2004 NHDS]
Ambulatory Care
There were 78 million ambulatory care visits with a primary diagnosis
of arthritis or other rheumatic conditions, or nearly 5% of all
ambulatory care visits that year. Overall, there were 66 million
ambulatory care visits with a primary or secondary diagnosis of
arthritis or other rheumatic conditions.
Arthritis Care Res 2010;62(4):460-4. [Data
Source: 2001–2005 National Ambulatory Medical Care Survey and
2001–2005 National Hospital Ambulatory Medical Care Survey]
Note: There are different data sources for some of the
arthritis related statistics; therefore, case definitions and
terminology will also vary.
Read more.
From 1979-1998, the annual number of arthritis and other rheumatic
conditions (AORC) deaths rose from 5,537 to 9,367.
J Rheumatology 2004;31(9):1823–1828. [Data Source: 1979–1998 National Vital
Statistics System]
Three categories of AORC account for almost 80% of deaths: diffuse connective
tissue diseases (34%), other specified rheumatic conditions (23%), and
rheumatoid arthritis (22%).
J Rheumatology 2004;31(9):1823–1828. [Data Source: 1979–1998 National Vital
Statistics System]
In 1979, the crude death rate from AORC was 2.46 per 100,000 population. In
1998, it was 3.48 per 100,000 population; rates age-standardized to the year
2000 population were 2.75 and 3.51, respectively.
J Rheumatology 2004;31(9):1823–1828. [Data Source: 1979–1998 National Vital
Statistics System]
Note: There are different data sources for some of the
arthritis related statistics; therefore,; case definitions and
terminology will also vary.
Read more.
In 2003, the total cost attributed to arthritis and other rheumatic conditions in the
United States was 128 billion dollars, up from 86.2 billion dollars in 1997.
MMWR
2007;56(01):4-7. [Data Source: 2003 Medical Expenditure Panel
Survey]
Medical expenditures (direct costs) for arthritis and other rheumatic conditions in
2003
were 80.8 billion dollars, up from 51.1 billion in 1997.
MMWR
2007;56(01):4-7. [Data Source: 2003 Medical Expenditure Panel
Survey]
Earnings losses (indirect costs) for arthritis and other rheumatic
conditions in 2003 were 47 billion dollars, up from 35.1 billion in 1997.
MMWR
2007;56(01):4-7. [Data Source: 2003 Medical Expenditure Panel
Survey]
Note: There are different data sources for some of the
arthritis related statistics; therefore,; case definitions and
terminology will also vary.
Read more.
Arthritis is strongly associated with major depression (attributable risk of
18.1%), probably through its role in creating functional limitation.
Medical Care 2004;42(6):502–511. [Data Source: 1996 Health and Retirement
Survey]
6.6% of adults with arthritis report severe psychological distress.
Int. J Public Health, 2009;S4:S75-83 [Data Source: 2007 Behavioral Risk Factor Surveillance
System]
Note: There are different data sources for some of the
arthritis related statistics; therefore,; case definitions and
terminology will also vary.
Read more.
In 2004, there were 454,652 total knee replacements performed, primarily for
arthritis.
United States Bone and Joint Decade: The Burden of
Musculoskeletal Diseases in the United States. Rosemont, IL: American
Academy of Orthopaedic Surgeons;2008.
In 2004, there were 232,857 total hip replacements, 41,934 shoulder,
and 12,055 other joint replacements, primarily for arthritis.
United States Bone and Joint Decade: The Burden of
Musculoskeletal Diseases in the United States. Rosemont, IL: American
Academy of Orthopaedic Surgeons;2008.
About the CDC
Our vision — a world where people with
arthritis live the fullest life possible, with the ability to pursue
valued life activities with minimal pain.
Our mission — to improve the quality of life of people affected by arthritis.
CDC and its partners are working to implement recommendations in the
National Arthritis Action Plan: A Public Health Strategy [PDF–394K] and
A National Public Health Agenda for Osteoarthritis [PDF - 3.33MB].
Each of these landmark public health plans were developed by CDC, the
Arthritis Foundation, and a diverse group of other organizations.
Each recommends a variety of activities to reduce pain, disability,
and improve the quality of life of persons affected by arthritis.
Our Goals:
Short-Term Goals
- Improve and increase self-management attitudes and behaviors among persons with arthritis.
- Increase early diagnosis and appropriate pain management.
Long-Term Goals
- Decrease pain and disability among persons with arthritis.
- Improve physical, psychosocial, and work function among persons with arthritis.
NationalObjectives for Arthritis are available in the
Healthy People 2020 report. More information is available on
Healthy People 2020.
Our Work
The Arthritis Program is working to —
- Measure the burden of arthritis. At the
national level, CDC uses surveys of the National Center for Health
Statistics to define the burden of arthritis, monitor trends, and
assess how arthritis affects quality of life. At the state level,
CDC and states (all 50, District of Columbia, and the 3
territories) use the Behavioral Risk Factor Surveillance System to
obtain arthritis burden data.
- Strengthen the science base. CDC
conducts or supports research to define the impact of arthritis in
the United States. We also support research to both develop and
evaluate interventions to help people with arthritis improve their
quality of life.
- Increase Awareness. CDC, working with
the Arthritis Foundation, states, and other partners is
supporting two health communications campaigns promoting
physical activity among people with arthritis: Physical Activity. The Arthritis Pain Reliever for English speaking audiences, and Buenos Días, Artritis for Hispanic audiences.
- Build State Arthritis Programs. State
Health Departments, with CDC support, are working to strengthen
partnerships, increase public awareness, and expand the reach of
interventions that have been proven to improve the quality of life
of people with arthritis.
Arthritis Program Staff
The Arthritis Program has a staff with expertise in
behavioral science, epidemiology, health communication, health
education, and project management. Currently, there are 14 full-time
staff devoting their efforts to the Arthritis Program at the CDC.
Program staff are involved in providing technical assistance for
research and programmatic efforts, collaborating with state
programs, analyzing data, and producing scientific reports.
Partnerships
Addressing the burden of arthritis requires coordinated and
collaborative efforts among many organizations, including
governmental and public health agencies, private organizations such
as the Arthritis Foundation and the Lupus Foundation of America,
aging agencies, health systems, and others. These types of alliances
help to assure the needed comprehensive approach to arthritis.
Find out more about our arthritis program partners.
The CDC Arthritis Program recommends evidence-based
programs that are proven to improve the quality of life of people with
arthritis. The programs currently being promoted are —
Each Program description also includes information about
how to locate these programs in your state. Self-management education
programs like the
Arthritis Self Management Program (ASMP) and
Chronic Disease Self-Management
(CDSMP) help teach people with arthritis techniques to manage
arthritis on a day-to-day basis. Research has shown that appropriate
physical activity offers substantial benefits to people with arthritis
and can decrease arthritis pain and disability. Preliminary studies
have shown the
Arthritis Foundation Exercise Program (formerly People with Arthritis Can Exercise or PACE), the
Arthritis Foundation Aquatic Program,
EnhanceFitness,
Walk With Ease,
Active Living Every Day, and
Fit and Strong!
to be both safe and effective for people with arthritis. In addition
to these physical activity programs, self-directed physical activity
can be beneficial. A physical activity
fact sheet and information detailing the importance of
physical activity for people with arthritis
are available. Intervention programs with promising evaluation data
and which are building the infrastructure to support program delivery
across the country are labeled “
Promising Programs”.
There are currently four intervention programs on our list of
Promising Programs. There are currently two physical activity
interventions on our “
Watch List”
for possible recommendation; Watch List programs are currently
undergoing evaluation to determine their effects on the health of
people with arthritis.
A journal article outlining the CDC Arthritis Program's
screening criteria
and selection process for recommending interventions for people with
arthritis has been published. An overview of each recommended
intervention and the implementation details is also included.
Brady TJ, Jernick SL, Hootman JM, Sniezek JE. Public
health interventions for arthritis: expanding the toolbox of
evidence-based interventions.
Journal of Women’s Health 2009;18(12):1905–1917.
abstract
- 50 million adults in the United States have doctor-diagnosed arthritis (just over 1 in 5 adults). Read more.
- The percentage of adults with arthritis ranges from
20% in California to 36% in Kentucky. State median is 26% in 2009.
View the prevalence data for each state – list of states – clickable map.
- Arthritis affects all race and ethnic groups: 36
million whites, 4.6 million blacks, 2.9 million Hispanics, 280,000
American Indians/Alaska Natives, 667,000 Asian/Pacific Islanders, and
469,000 multiracial/others. Read more.
- The risk of arthritis increases with age and is more common among women than men. Read more.
- In all U.S. states, 1 in 3 working-age adults (18-64
years old) face work limitations they attribute to arthritis; the
prevalence of work limitations due to arthritis varies by state. Read more.
- An estimated 294,000 children under age 18 have some
form of arthritis or rheumatic condition, this represents
approximately 1 in every 250 children. abstract – arthritis type table – state table
- Arthritis is the most common cause of disability in the United States. Read more. View graph.
- Number of U. S. Adults Reporting a Disability is Increasing — A
new CDC study shows that 47.5 million US adults (21.8%) reported a
disability 1 in 2005, an increase of 3.4 million from 1999.
Arthritis or rheumatism (8.6 million) continues to be the most
common cause of disability, while back or spine problems (7.6 million)
and heart trouble (3.0 million) round out the top three causes.
Read more in the MMWR and CDC Feature.
- Nearly 21 million adults say that arthritis limits their usual activities in some way. Read more.
- State-specific prevalence estimates of
arthritis-attributable work limitation show a high impact of
arthritis on working-age (18-64 years) adults in all U.S. states,
ranging from a low of 3.4% to a high of 15% of 1 in 2 adults with
arthritis in this age group. Read more. State maps relating to this publication are available. Map 1 and Map 2
- 8.2 million working aged U.S. adults (about 1 in 20) report work limitations due to arthritis or joint symptoms. Read more.
- Blacks and Hispanics with arthritis have almost
twice the prevalence of work limitation and severe pain compared
to Whites. Read more.
- In 2003, the total cost attributed to arthritis and
other rheumatic conditions in the United States was 128 billion
dollars, up from 86.2 billion dollars in 1997. ($80.8 billion in
medical care expenditures and $47 billion in earnings losses). Read more.
- Medical expenditures (direct costs) for arthritis and
other rheumatic conditions in 2003 were 80.8 billion dollars, up from
51.1 billion in 1997. Read more.
- Earnings losses (indirect costs) for arthritis and
other rheumatic conditions in 2003 were 47 billion dollars, up from
35.1 billion in 1997. Read more.
- States ranged from $121 million in Wyoming to $8.4 billion in California. Read more.
- Effective strategies exist to reduce the impact of arthritis. Read more.
- Anticipating employment disability due to arthritis
and addressing employment barriers through increased education,
awareness, workplace accommodations, and other interventions can help
reduce arthritis disability in the U.S. workforce. Read more.
- A new CDC study shows that arthritis may be
an unrecognized barrier for adults with heart disease attempting to
manage their condition through physical activity; 29% of people with
both conditions are physically inactive compared to 21% with heart
disease alone. Read more in the MMMWR and CDC Feature.
- More than half of adults with diagnosed
diabetes also have arthritis. The study found that 29.8% of adults with
arthritis and diabetes were physically inactive, compared with 21% of
people with diabetes alone. Among people with diabetes, the high
frequency of arthritis appears to be an under recognized barrier to
increasing physical activity, a recommended diabetes intervention.
Engaging in joint friendly activities; such as, walking, swimming,
biking, and participating in available arthritis-specific exercise
interventions can help manage both conditions. Read more.
Are you surprised by any of these statements? If
so, you’re not alone. Most of us don’t realize the significant and
serious impact arthritis has on a person’s quality of life, our
country’s economy, and the health of our nation. It is more than “just
aches and pains.”
Simple Steps for People with Arthritis